One more day at the lab
Vero always surprises me with daily lab problems that could be automated to make her life easier. This time she showed me a Google spreadsheet where all the wet-lab people in the lab keep track of the physical location of the samples.
Her idea was to have a map of every box of every rack of each of the two tanks we have in the lab. She was looking for an easy formula conditional coloring cells to show the available space in each box. After trying several times to find the correct formula to do the job for us, we either ended up with a overcomplicated formula that didn’t work or we couldn’t reference correctly what we really wanted. We really tried, and tried. We even called our powerful friend ChatGPT to give it a try, but it ended up with the same luck as us.
Ideally, the map should be on a separate sheet and it should be updated every time someone makes a change on the samples. We had three options: 1) forget about it, 2) create it and maintain it manually (my favorite idea), or 3) use the App Script extension in Google Sheets to do the job that standard functions couldn’t.
Fun begins
I hadn’t used App Script before, but what could be the problem? If only everything could be Python … but no, it has to be JavaScript-based. At least after this I could add JavaScript to my CV.
So, to make the problem easier, we have a spreadsheet with all the samples data information and some columns like this:
| Tank | Rack | Box | Position |
|---|---|---|---|
| 1 | 1 | 1 | 9 |
| 1 | 2 | 2 | 34 |
| 1 | 2 | 2 | 53 |
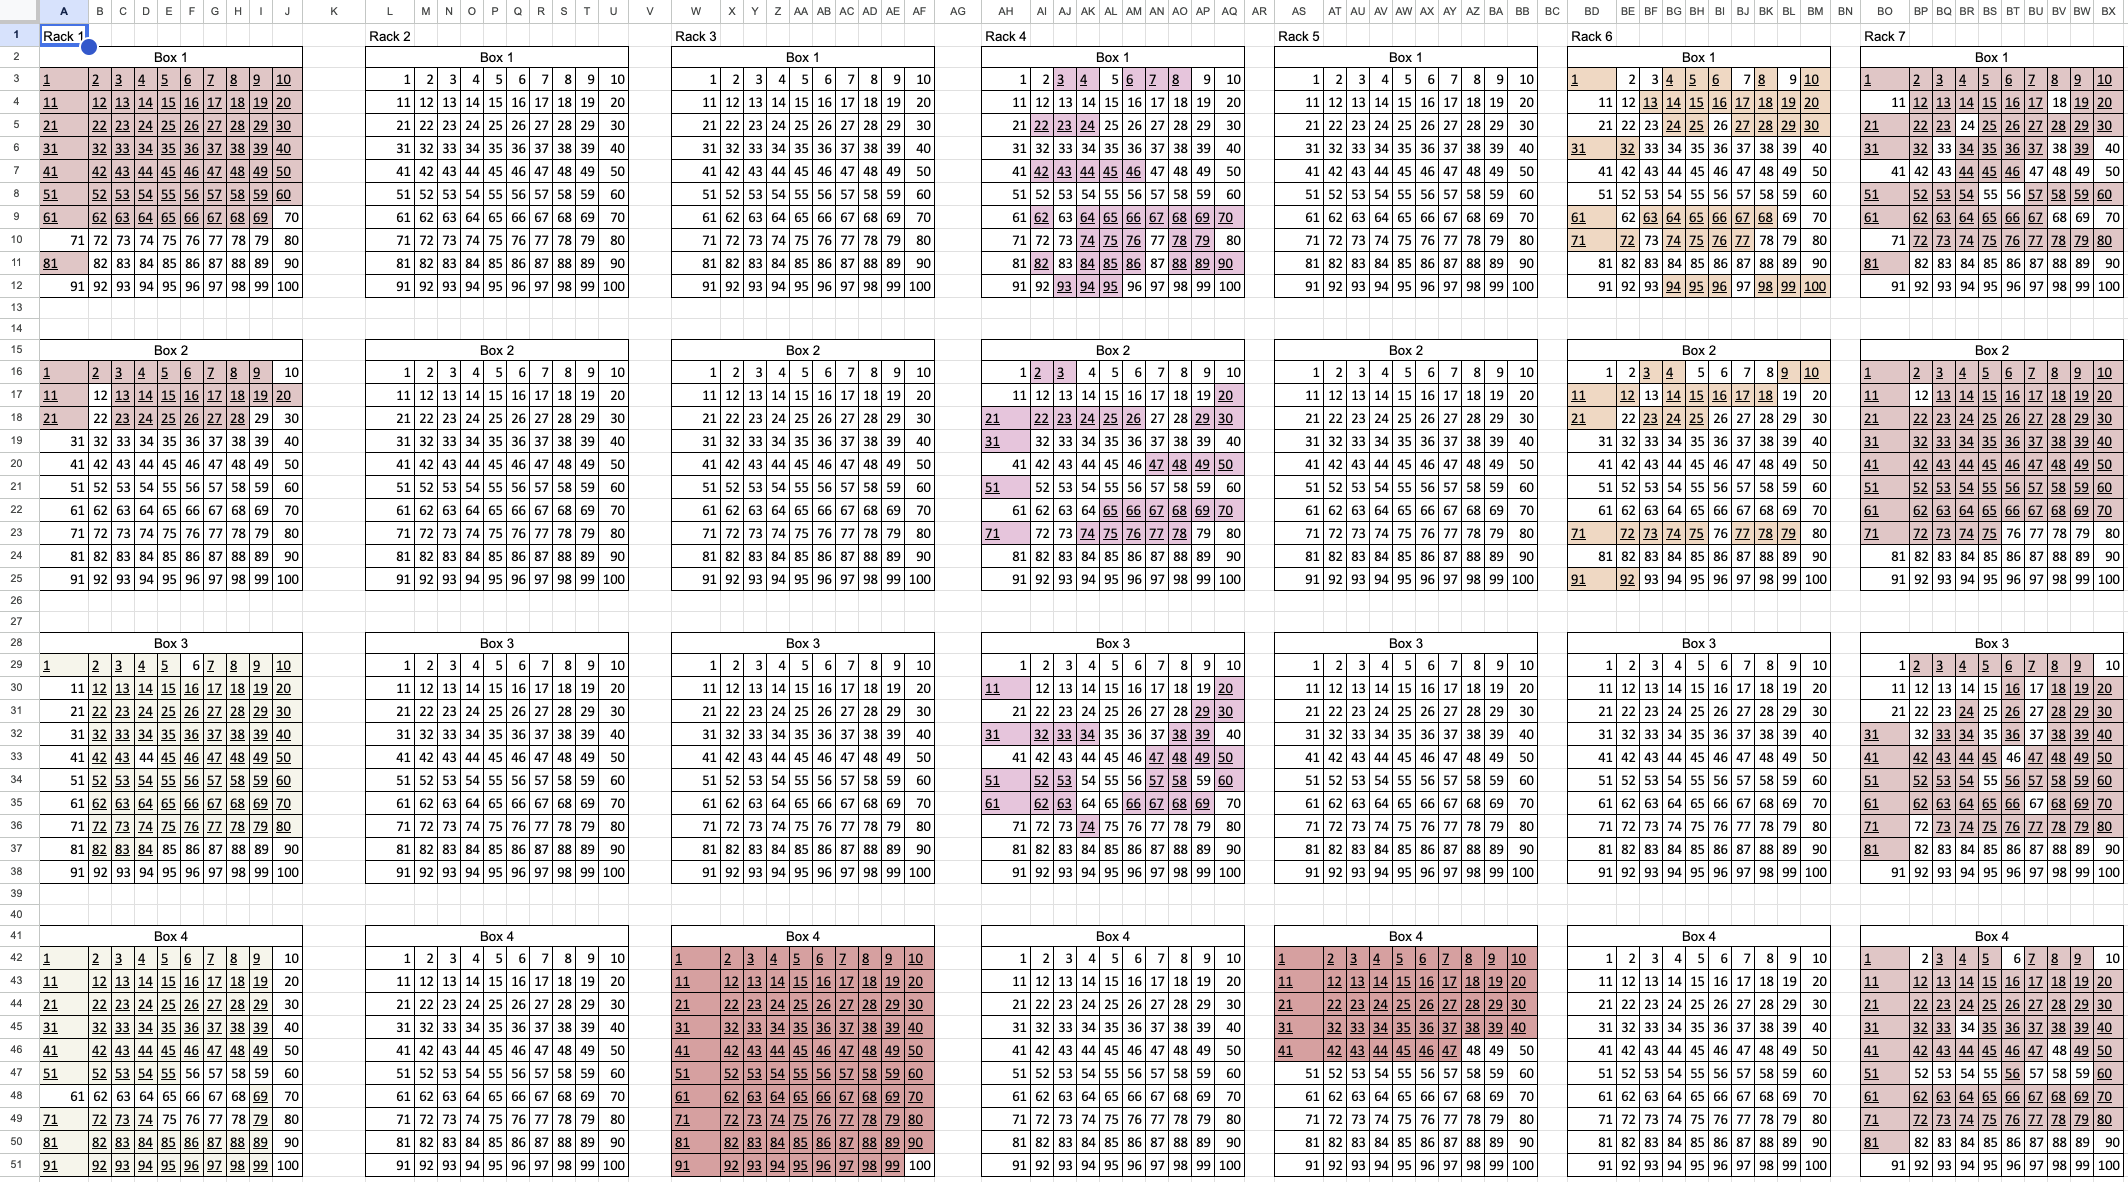
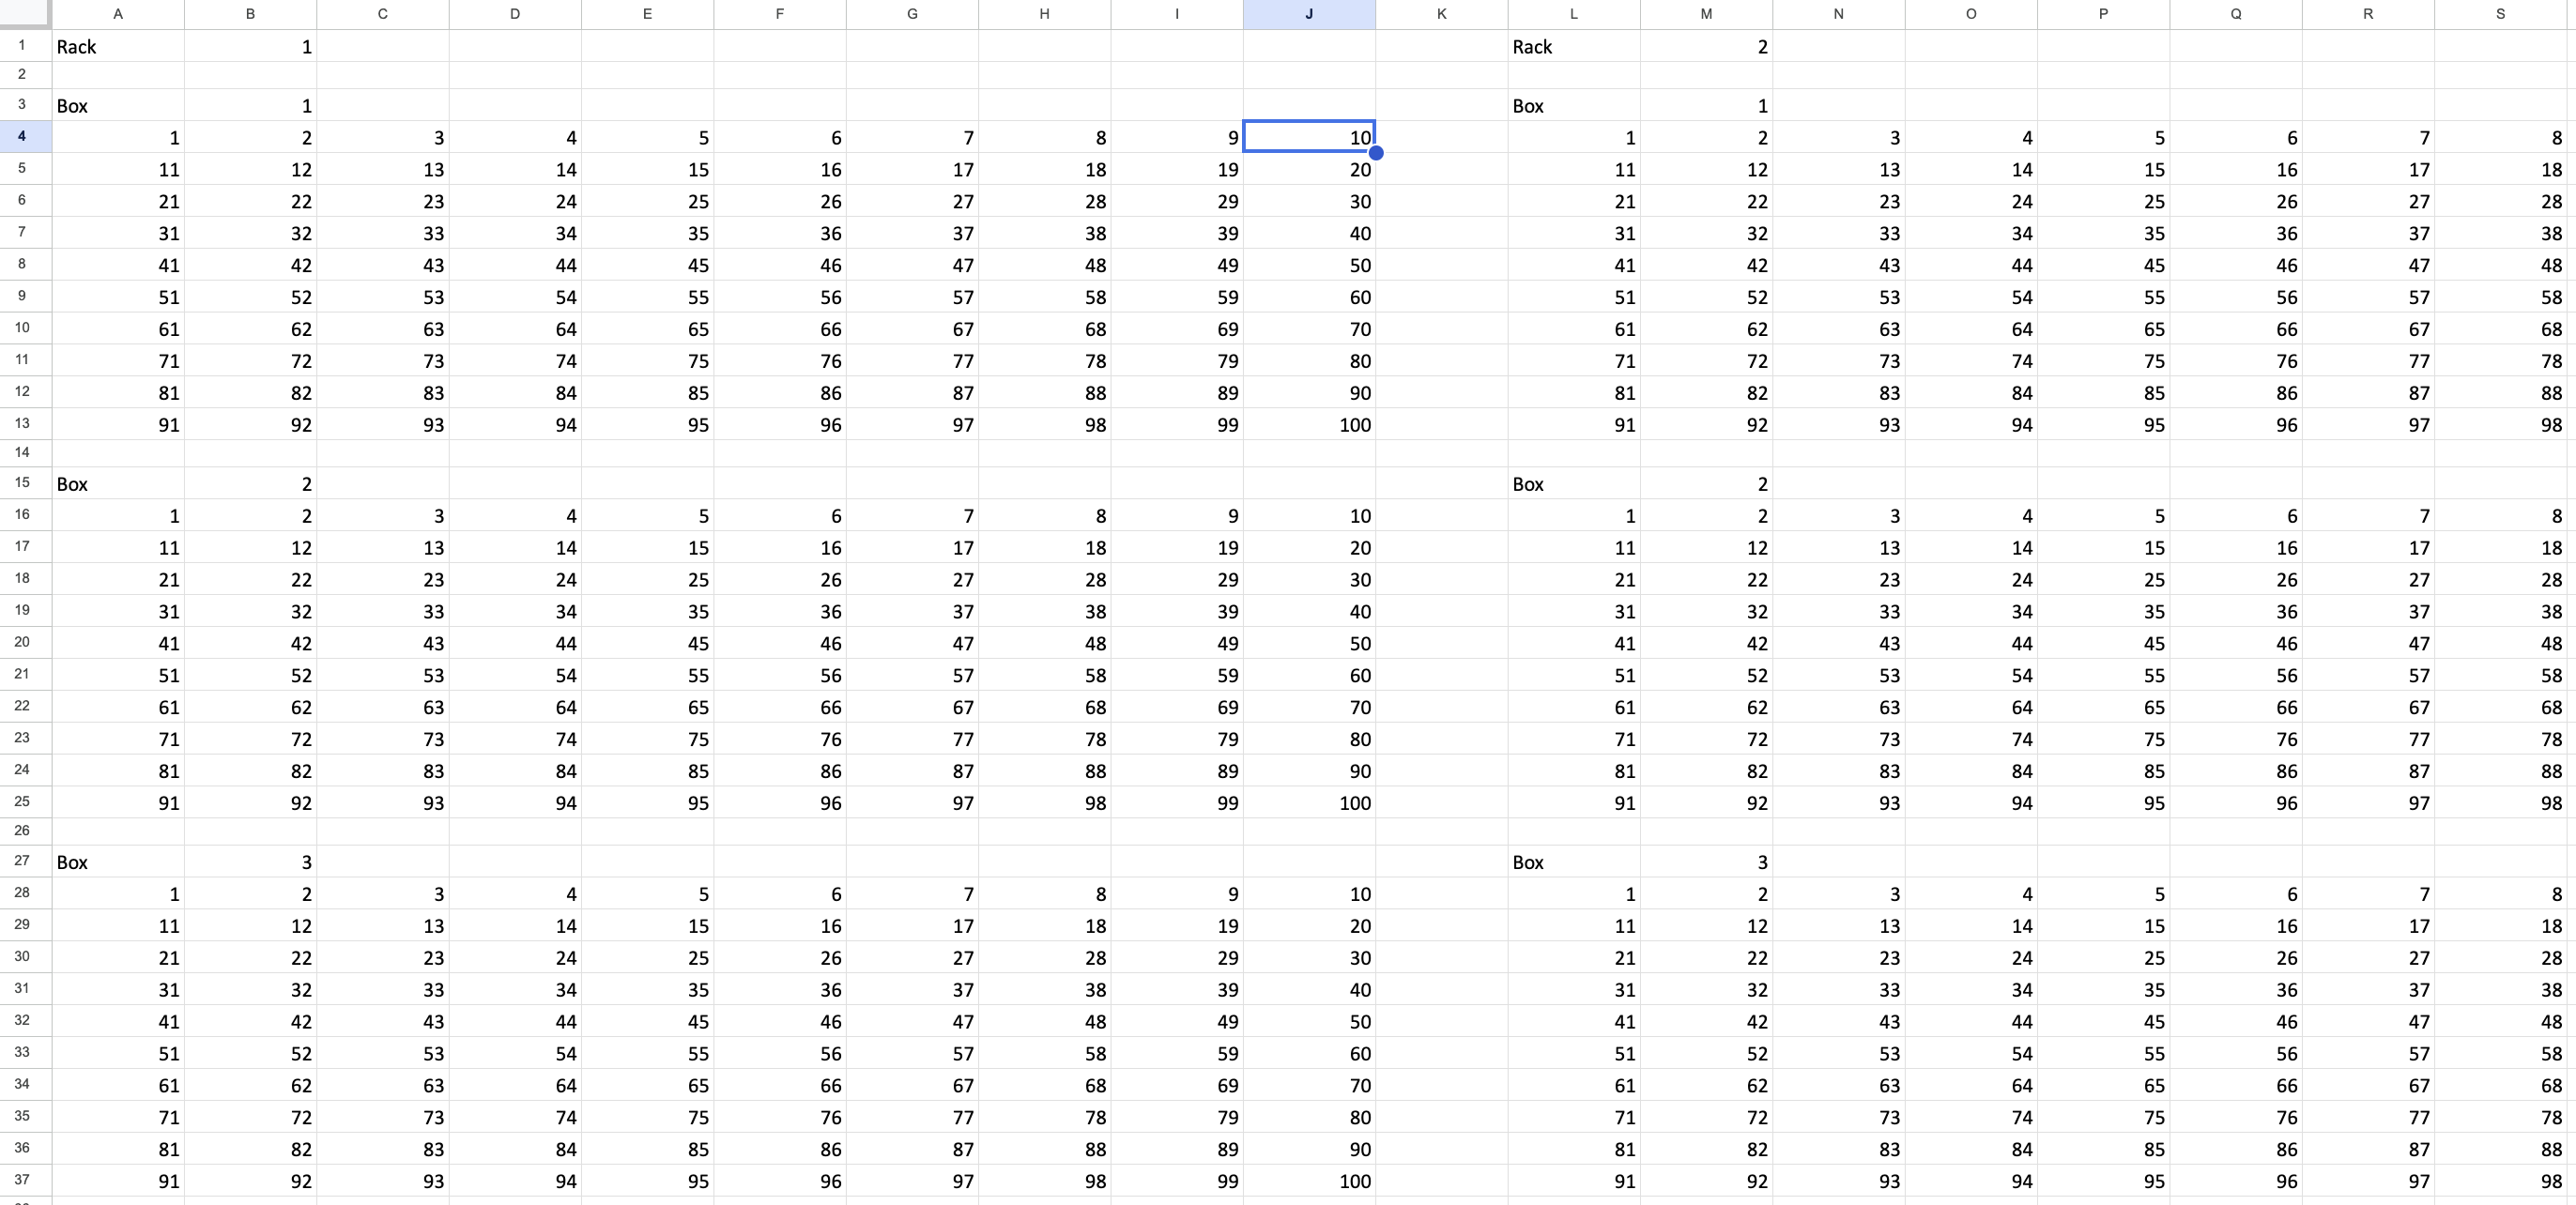
Vero told me these tanks can have 15 racks, each with 15 boxes, and each box with 100 positions. So, we agreed to have a separate sheet for each tank with this structure (at least as first draft):
The idea was to create a nested dictionary with the data from the columns above. That would be our coordinates, and we could use them to fill the map. The challenging part was to retrieve all the information without unnecesary calls to complicated methods. It was like remembering how to code from scratch to make it work efficiently.
Mapping the coordinates to the other sheet was easier once I got used to it. The rack name was in the first row and the box name in the same column where the rack information was. All the positions were below the box name in a 10 x 10 matrix. So, by knowing the coordinates of the rack and the box we could calculate the relative coordinates of the position like:
var rowPos = Math.ceil(Number(posValue)/10); // Get the row index of the position
var colPos = Number(posValue)%10; // Get the column index of the position
if (colPos === 0) {
  colPos = 10;
};
Finally, by knowing the right positions we could fill the map and add an hyperlink referencing to their data in the other sheet like:
var clinicalLinkFormula = '=HYPERLINK("#gid=' + clinicalSheetIdx +
                                  '&range=' + coordinates[rackValue][boxValue][posValue] + '","' + posValue + '")';
// Set the hyperlink formula to the cell and change color
sheet.getRange(rowPos, colPos).setFormula(clinicalLinkFormula).setBackground(color);
The final result
After some hours (days) of coding, testing, and debugging, we got last version. It still needs improvemets, but it works. We have a map of the available space for the samples in the lab. It is not perfect, but it would help to see what changes are needed to make it better, and what things do we have to add. This is how it looks, it takes information from multiple project sheets and colors the map for each of them: